What is Atterberg Limits in Geotechnical Engineering?
In 1900s, Engr. Albert Atterberg developed a method to classify the consistency of fine-grained soils based on their moisture content, which led to the identification of the Atterberg Limits, a key indicator of soil behavior in different states.
Atterberg Limits are water content boundaries that define the behavioral states of fine-grained soils.
They include:
- Shrinkage Limit
- Plastic Limit
- Liquidity Limit
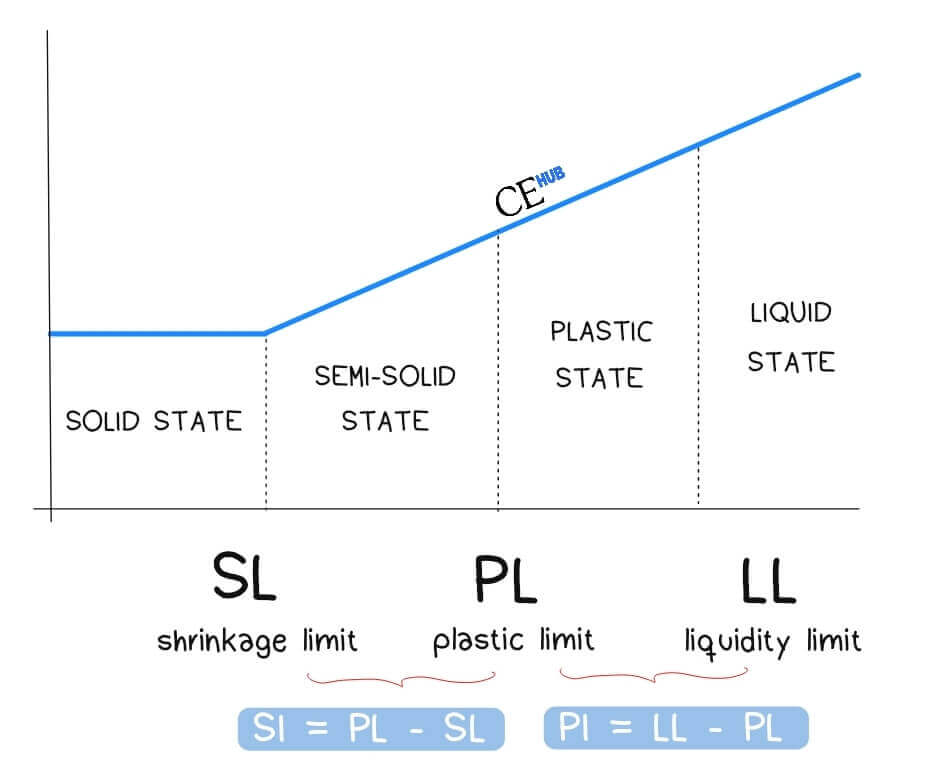
The Key States are:
- Solid States: No change in volume, no moisture.
- Semi-Solid States: Cracks were present when molded due to a little bit of moisture.
- Plastic State: Soil can be molded without cracking.
- Liquid State: Soil flows like a liquid.
1. Liquid Limit (LL)
What is liquid limit and why is it important?
The Liquid Limit is the upper plastic limit, the water content at which soil transitions from the liquid state to the plastic state. It represents the minimum moisture content at which soil flows under application of very small shear force.
Testing Method
Casagrande Cup Method
- Soil paste is placed in the Casagrande cup, and a groove is made through the center.
- The liquid limit is defined as the moisture content (%) required to close a standard 0.5-inch (12.5 mm) groove after exactly 25 blows of the liquid limit device.
- Achieving the precise 25-blow closure is challenging, so multiple tests are conducted at varying moisture contents with blow counts between 15 and 35.
Cone Penetrometer Method
- An alternative method to the Casagrande Method
2. Plastic Limit (PL)
What is plastic limit and why is it important?
Soil at this consistency is starting become plastic, flexible and moldable.
How it’s tested:
- Take a small amount of moist soil.
- Air dry to reduce water content.
- Roll it into 3 mm diameter threads on a glass plate.
- When threads cracks at exactly 3 mm diameter, determine its water content.
3. Shrinkage Limit (SL)
What is shrinkage limit and why is it important?
Shrinkage limit is the water content below which additional drying does not result in a decrease in soil volume.
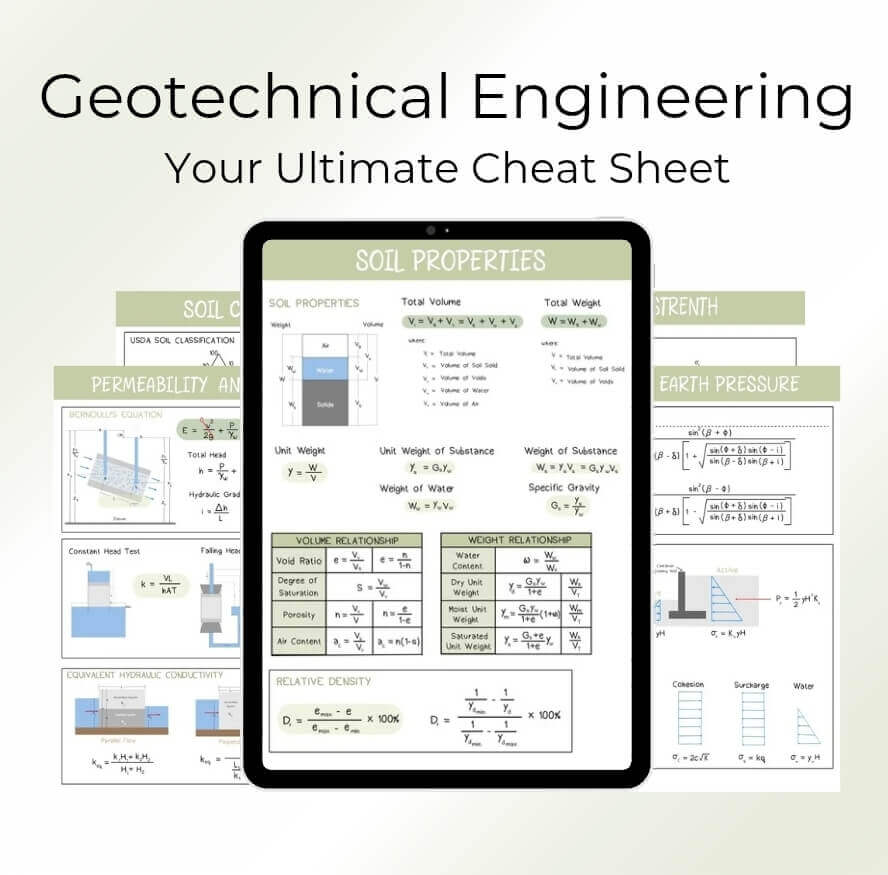
Geotechnical Engineering Cheat Sheet
Master the principles of soil mechanics with this comprehensive cheat sheet. Perfect for students and professionals!
Overview of the Formulas
| Index | Engineering Behaviour | Formula |
| Plasticity | Clay Content Indicator | |
| Shrinkage | Volume Change | |
| Liquidity | Natural Consistency | |
| Consistency | Stiffness | |
| Flow | Moisture Sensitivity | |
| Toughness | Clay Toughness | |
![\[PI= LL-PL\]](https://civilengghub.com/wp-content/ql-cache/quicklatex.com-67bd9e68e6cfc4ec37a06af74b56d000_l3.png "Rendered by QuickLaTeX.com")
![\[SI=PL-SL\]](https://civilengghub.com/wp-content/ql-cache/quicklatex.com-fed7d4df1416e67f2260c1384eeb2ce1_l3.png "Rendered by QuickLaTeX.com")
![\[LI=\frac{w-PL}{LL-PL}\]](https://civilengghub.com/wp-content/ql-cache/quicklatex.com-ed87ce7b7eb491c8aa70fd2e2d9dcf2e_l3.png "Rendered by QuickLaTeX.com")
![\[CI=\frac{LL-w}{LL-PL}\]](https://civilengghub.com/wp-content/ql-cache/quicklatex.com-2dba4f480c21dc16936bbe260ea32c50_l3.png "Rendered by QuickLaTeX.com")
![\[FI= \frac{w_1-w_2}{log(N_2/N_1)} \]](https://civilengghub.com/wp-content/ql-cache/quicklatex.com-9a623a4667bef5fb82f99e00e59a93d0_l3.png "Rendered by QuickLaTeX.com")
![\[TI=\frac{PI}{FI}\]](https://civilengghub.com/wp-content/ql-cache/quicklatex.com-a5c8f0985b9eb7b93e072ffae9b35da0_l3.png "Rendered by QuickLaTeX.com")
Plasticity Index (PI)
How do you calculate Plasticity Index and what does it mean?
PI is the range between the Liquid and Plastic Limits, basically, how much room there is for soil to behave plastically.
To calculate Plasticity Index, use the formula:
![\[PI = LL - PL \]](https://civilengghub.com/wp-content/ql-cache/quicklatex.com-947a73428469bf93e7131ed7ecf136b6_l3.png "Rendered by QuickLaTeX.com")
According to Burmister (1949), this is how he classified plasticity index.
| PI | Description |
| 0 | Nonplastic |
| 1 – 5 | Slightly Plastic |
| 5 – 10 | Low Plasticity |
| 10 – 20 | Medium Plasticity |
| 20 – 40 | High Plasticity |
| > 40 | Very High Plasticity |
Example
If LL is 50% and PL is 25%, then PI = 25.
This means that the soil is highly plastic, and likely to expand or shrink significantly.
Engineering Significance
Higer PI indicates that it has more volume clay content. With greater volume change potential, the higher its compressibility.
Shrinkage Index
What is shrinkage index and how do you calculate it?
It measures the volume change potential of clay soils during drying. It also indicates the natural consistency of clay soil relative to its plastic range.
To calculate this, use the formula:
![\[SI = PL - SL \]](https://civilengghub.com/wp-content/ql-cache/quicklatex.com-d0b881eba57a7fae6d2d0ac95e179c5b_l3.png "Rendered by QuickLaTeX.com")
Liquidity Index
What is liquidity index and how to calculate it?
LI is the flip side (not reciprocal) of CI. It shows how liquid the soil is based on its moisture content.
![\[LI = \frac{w-PL}{LL-PL} \]](https://civilengghub.com/wp-content/ql-cache/quicklatex.com-ecabdb72e6cdc81e7524cef23006f7b8_l3.png "Rendered by QuickLaTeX.com")
Example
LI = (35 – 25) / 25 = 0.4
Then based from the table, the soil still sits in the plastic range.
| LI Value | Soil State |
|---|---|
| LI < 0 | Solid |
| LI = 0 | At Plastic Limit |
| LI = 1 | At Liquid Limit |
| LI > 1 | Very soft/liquid-like |
Consistency Index (CI)
What is constency index and how to calculate it?
CI shows how close the current water content is to the soil’s plastic and liquid limits.
![\[CI = \frac{LL-w}{LL-PL}] <!-- /wp:paragraph --></div> <!-- /wp:column --></div> <!-- /wp:columns --> <!-- wp:paragraph --> <!-- /wp:paragraph --> <!-- wp:table {"className":"is-style-stripes"} --> <figure class="wp-block-table is-style-stripes"><table class="has-fixed-layout"><thead><tr><th class="has-text-align-center" data-align="center"><strong>CI Value</strong></th><th class="has-text-align-center" data-align="center"><strong>Soil State</strong></th></tr></thead><tbody><tr><td class="has-text-align-center" data-align="center">CI > 1</td><td class="has-text-align-center" data-align="center">Semi-solid</td></tr><tr><td class="has-text-align-center" data-align="center">CI = 1</td><td class="has-text-align-center" data-align="center">At Plastic Limit</td></tr><tr><td class="has-text-align-center" data-align="center">CI = 0</td><td class="has-text-align-center" data-align="center">At Liquid Limit</td></tr><tr><td class="has-text-align-center" data-align="center">CI < 0</td><td class="has-text-align-center" data-align="center">Liquid-like</td></tr></tbody></table></figure> <!-- /wp:table --> <!-- wp:paragraph --> <strong>Example:</strong> <!-- /wp:paragraph --> <!-- wp:paragraph --> LL = 50, PL = 25, w = 35 <!-- /wp:paragraph --> <!-- wp:paragraph --> PI = 25, CI = (50 - 35) / 25 = 0.6 <!-- /wp:paragraph --> <!-- wp:paragraph --> <em>The soil is in the plastic range but neither too wet nor too dry.</em> <!-- /wp:paragraph --> <!-- wp:paragraph --> <!-- /wp:paragraph --> <!-- wp:heading {"fontSize":"large"} --> <h2 class="wp-block-heading has-large-font-size" id="flow-index">Flow Index</h2> <!-- /wp:heading --> <!-- wp:quote --> <blockquote class="wp-block-quote"><!-- wp:paragraph --> Flow index is the slope of the curve and this can be expressed as: <!-- /wp:paragraph --></blockquote> <!-- /wp:quote --> <!-- wp:columns {"style":{"border":{"radius":"20px","color":"#4adede","width":"2px"},"spacing":{"padding":{"top":"17px","bottom":"17px","left":"20px","right":"20px"},"blockGap":{"top":"var:preset|spacing|70","left":"var:preset|spacing|70"},"margin":{"top":"0","bottom":"0"}},"elements":{"link":{"color":{"text":"var:preset|color|palette-color-4"}}}},"backgroundColor":"palette-color-6","textColor":"palette-color-4"} --> <div class="wp-block-columns has-border-color has-palette-color-4-color has-palette-color-6-background-color has-text-color has-background has-link-color" style="border-color:#4adede;border-width:2px;border-radius:20px;margin-top:0;margin-bottom:0;padding-top:17px;padding-right:20px;padding-bottom:17px;padding-left:20px"><!-- wp:column --> <div class="wp-block-column"><!-- wp:paragraph --> \[FI= \frac{w_1-w_2}{log(N_2/N_1)} \]](https://civilengghub.com/wp-content/ql-cache/quicklatex.com-234f3c27267e2ed38256f121d3dfc5f3_l3.png "Rendered by QuickLaTeX.com")
where: = moisture content corresponding to number of blows of
 = moisture content corresponding to number of blows of
Other Formulas:
Shrinkage Limit Test
Shrinkage Limit can be calculated using this formula
![\[SL= \frac{m_1-m_2}{m_2}-\frac{(V_1-V_2)\rho_w}{m_2}\]](https://civilengghub.com/wp-content/ql-cache/quicklatex.com-d932227ce803257a43442f6b38060848_l3.png "Rendered by QuickLaTeX.com")
where:  = mass of wet soil
  = mass of oven-dried soil
 = volume of wet
  = volume of oven-dried soil
Shrinkage Ratio
Shrinkage ratio is the ratio of the change in void ratio to the change in water content when soil dries from a saturated state to an oven-dry state.
![\[SR=\frac{m_2}{V_2\rho_w}\]](https://civilengghub.com/wp-content/ql-cache/quicklatex.com-f87bb00792a89b0fc960ca62ff8f2407_l3.png "Rendered by QuickLaTeX.com")
Specific Gravity of Solids
![\[G = \frac{1}{\frac{1}{SR}-\frac{SL}{100}}\]](https://civilengghub.com/wp-content/ql-cache/quicklatex.com-950685322354099274558ada8e7995b9_l3.png "Rendered by QuickLaTeX.com")
References:
Das, B. M. (2013). Fundamentals of geotechnical engineering. Cengage Learning.
Geo Engineer. (2020). Atterberg Limits. Www.geoengineer.org. https://www.geoengineer.org/education/laboratory-testing/atterberg-limits
(2025). Youtu.be. https://youtu.be/CL-Rxg8bE6M?si=bo3Wcdee6Ssz1CuB